How to find your real safe cruise speed
The max speed on your spec sheet isn’t yours. It’s a lab number - light rider, full battery, mild weather, flat ground, fresh cells, the wheel set to racing mode, everything optimized to produce the highest possible figure. Your real safe cruise speed is lower. Usually 70-85% of the claimed number, often less. This guide shows you how to find yours.
What you need
- Your wheel
- A phone with EUC World, WheelLog, or DarknessBot, if your wheel and app expose PWM or power (for methods 2 and 3)
- An empty, straight, flat road with good visibility (for method 3)
- Honest answers about your weight, your battery habits, and your routes
Why the number on the box isn’t yours
The physics is covered in the field-weakening article. The practical upshot: at the advertised max speed, the controller is running 85-95% PWM under ideal conditions. PWM is the margin the controller has to keep you balanced - at 90%, there’s 10% left for a bump or a gust. At 100%, there is no reserve left to keep the pendulum balanced. That is not a designed cutoff; in practice it becomes overpower, overlean, or a faceplant.
Five variables eat that margin the moment you leave the lab:
- Rider weight. Heavier rider, more current, more voltage sag, higher PWM at the same speed
- Battery state of charge. Lower SoC means lower resting voltage and worse sag under load. Higher PWM required to maintain the same speed
- Temperature. Cold cells have higher internal resistance. More sag. More PWM
- Cell age. A pack at 15,000 km (9,320 mi) sags harder than a fresh one. Same speed, more margin consumed
- Grade and wind. Uphill or headwind increase motor load at the same speed. Same PWM math
These compound. The same speed can be fine in June on a warm, fresh battery and risky in winter with lower SoC, an older pack, and a headwind. Your speedometer still shows your normal cruise, but the controller may be running 20+ percentage points higher PWM than your baseline. You’re riding much closer to the edge than you think.
Method 1: The 80% rule
Zero tools. Works for anyone on any wheel.
Take the manufacturer’s claimed max speed. Multiply by 0.8. Cruise there or below.
- Wheel claims 85 km/h (53 mph) → cruise at or below 68 km/h (42 mph)
- Wheel claims 70 km/h (43 mph) → cruise at or below 56 km/h (35 mph)
- Wheel claims 95 km/h (59 mph) → cruise at or below 76 km/h (47 mph)
Approximate, but dramatically better than trusting the spec directly. Use this if you ride without an app or you just want a mental ceiling. For heavier riders (100+ kg / 220+ lbs), mountain terrain, or cold winters, drop to 70% rather than 80%.
Method 2: PWM monitoring in an app
The real method. Gives you a number tied to your actual ride, not the lab’s.
Setup:
- Install EUC World, WheelLog, or DarknessBot
- Connect your wheel via Bluetooth
- Open the live dashboard with PWM visible
- Set a safety margin alarm. Conservative target: alarm triggers at sustained 80% PWM
How to use it:
Ride your normal routes at your normal speeds. Watch sustained PWM - the steady-state reading after you’ve held a speed for 5+ seconds, not the spike during acceleration.
- Below 70% sustained PWM - plenty of margin. Safe cruise territory
- 70-80% sustained PWM - the soft ceiling. Fine for short bursts, not for cruising
- Above 80% sustained PWM - diminishing returns. Every extra km/h costs real margin
- Alarm fires - slow down. Don’t argue with it
Your cruise speed is the fastest speed where you sustain below 70% PWM in your worst expected conditions (cold, low battery, older pack). Not your best conditions.
Method 3: Personal PWM curve
For riders who want the real data. One focused session, and you know your number.
Conditions:
- Battery at 60-80% (mid-range, not fresh from charger)
- Empty, straight, flat road with no wind
- Full gear on - this is a high-speed test
- Logging enabled in EUC World, WheelLog, or DarknessBot (CSV export)
Protocol:
Ride at constant speed through a stable cruise of 10+ seconds at each target. Record PWM during the stable portion, not during acceleration. Repeat 3× at each speed and average.
Target speeds: 30, 40, 50, 60, 70 km/h (19, 25, 31, 37, 43 mph) - and higher if your wheel claims it and you have the skills.
What you get:
Plot speed against average PWM in any spreadsheet. You’ll see a curve that stays relatively flat at low speeds, then rises steeply at some point. That inflection is your base speed - the start of field weakening for your specific rider-plus-wheel combination.
Your cruise ceiling: the speed where the curve crosses 70% PWM. That’s your real cruise number in current conditions.
Repeat the same protocol at 30% battery, or on a cold morning, or with a 10 kg (22 lbs) loaded backpack, and the curve shifts left. That shift is the gap between the spec sheet and reality, made visible.
Don’t have PWM in your app?
Some wheels don’t report PWM over Bluetooth, and some apps don’t expose it. If your wheel or app behaves that way, use power draw instead. Power rises at the same inflection point PWM does - it’s the same physics seen through a different window. Plot speed on X, mean power in W on Y. Look for the point where the curve starts rising noticeably faster. Set your ceiling 5-10 km/h below it. Method is identical. Data is just less direct.
Worked example - what the curve actually looks like
Here is what one session of Method 3 produces. Six runs of the same 3.2 km urban loop, 110 kg rider, Extreme Bull GT PRO+ (168V, Samsung 50S), 2-second samples from EUC World. Speed on X, mean power per 2 km/h bin on Y, with the 25th-to-75th percentile range shaded so you can see the noise.
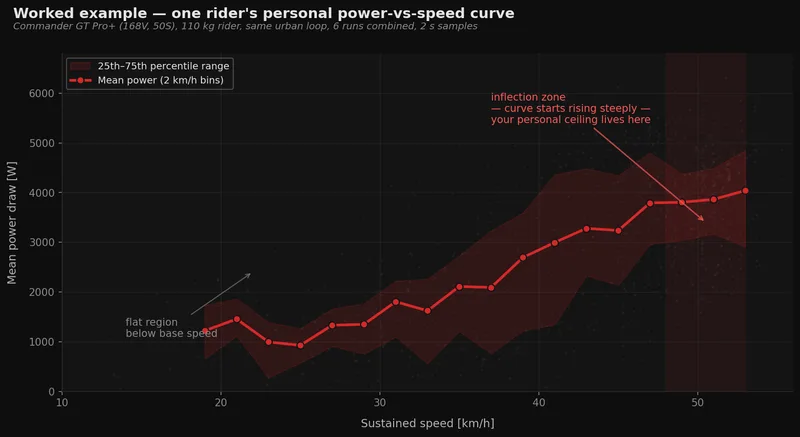
What to read from it. From 20 to 45 km/h, mean power climbs gradually - roughly 90 W per additional km/h. This is the flat region. You’re well below base speed; the motor has plenty of voltage headroom, field-weakening current is minimal, and every extra km/h costs about what drag physics predicts. From 47 km/h upward, the slope starts to change. The IQR band widens. Individual samples scatter more. That’s the controller starting to work harder - field weakening beginning to engage, voltage sag amplifying on acceleration spikes, back-EMF closing in on battery voltage.
For this rider on this wheel, the safe cruise ceiling is around 52 km/h - below the inflection zone, with margin. The manufacturer’s claimed max speed is 200 km/h (off-road free spin) or 257 km/h (racing free spin). The 80% rule on claimed max would give 160 km/h. The real number, measured on the actual wheel, is less than a third of that.
One honest caveat. On this wheel, at the speeds this rider reached (max ~55 km/h), the inflection point is mild. It is not a sudden cliff on the chart; it is the point where power starts rising faster than it did before. The rider didn’t push deep enough into field weakening to produce a sharp inflection - which on this 168V wheel would require cruising at 65-75 km/h. That’s fine. The method still works: find the speed where your curve starts departing from the gradual early slope, and sit 5-10 km/h below it. On a lower-voltage wheel (134V, 126V), or a heavier rider, or a lower SoC, the inflection is sharper and appears earlier. A rider on a 134V wheel running the same protocol would likely see a clear inflection zone in the 40-45 km/h region instead of a gentle bend past 50 km/h.
Why most reviewers don’t publish this
Logging sessions at high speed on unfamiliar wheels is dangerous. Three clean runs at each speed for a reliable curve is a full day’s work. Sponsors don’t want “my unit ran 89% PWM at the advertised max, don’t cruise there” in a video. Viewer retention favors “let’s send it” over scatter plots. The result: you see “plenty of power at 75 km/h (47 mph), felt super smooth” from a reviewer who tested at 70 kg (154 lbs) on a full battery on a closed course, and you extrapolate to your 95 kg (209 lbs) commute at 40% battery in the cold. The reviewer isn’t lying. The extrapolation is the problem.
555 take
The max speed on your spec sheet is an engineering data point, not a riding recommendation. It’s the upper bound of what the wheel has ever done, not your personal ceiling.
Start with the 80% rule. If you ride seriously, graduate to PWM monitoring. If you want to actually know where your edge is, run the curve once. Ten minutes of measurement beats a year of guessing.
Your real cruise speed is lower than the box promises, and it changes. The wheel that’s safe at 70 km/h (43 mph) in June at 80% battery can be on the edge at 65 km/h (40 mph) in January at 40%. Check. Don’t assume.